
Article
Bloomberg
The Tracker
How Are We Tracking?
The Speed & Scale plan shows how we can cut greenhouse gas emissions to net zero by 2050 and get halfway there by 2030. Explore the tracker below to monitor progress across ten critical objectives and their key results.
Emissions
1.0
Electrify Transportation
→
Reduce 8 gigatons of transportation emissions to 2 gigatons by 2050.
2.0
Decarbonize the Grid
→
Reduce 24 gigatons of global electricity and heating emissions to 3 gigatons by 2050.
3.0
Fix Food
→
Reduce 9 gigatons of agricultural emissions to 2 gigatons by 2050.
4.0
Protect Nature
→
Go from 6 gigatons of emissions to -1 gigatons by 2050.
5.0
Clean Up Industry
→
Reduce 12 gigatons of industrial emissions to 4 gigatons by 2050.
6.0
Remove Carbon
→
Remove 10 gigatons of carbon dioxide per year from the atmosphere.
Track the Progress of Our OKRs
1.0
Electrify Transportation
→
Reduce 8 gigatons of transportation emissions to 2 gigatons by 2050.
2.0
Decarbonize the Grid
→
Reduce 24 gigatons of global electricity and heating emissions to 3 gigatons by 2050.
3.0
Fix Food
→
Reduce 9 gigatons of agricultural emissions to 2 gigatons by 2050.
4.0
Protect Nature
→
Go from 6 gigatons of emissions to -1 gigatons by 2050.

5.0
Clean Up Industry
→
Reduce 12 gigatons of industrial emissions to 4 gigatons by 2050.
6.0
Remove Carbon
→
Remove 10 gigatons of carbon dioxide per year from the atmosphere.

The Book
Read the book that everyone—from Meryl Streep to Barack Obama—is talking about. From the #1 bestselling author of Measure What Matters comes Speed & Scale: An Action Plan for Solving Our Climate Crisis Now.
Order the book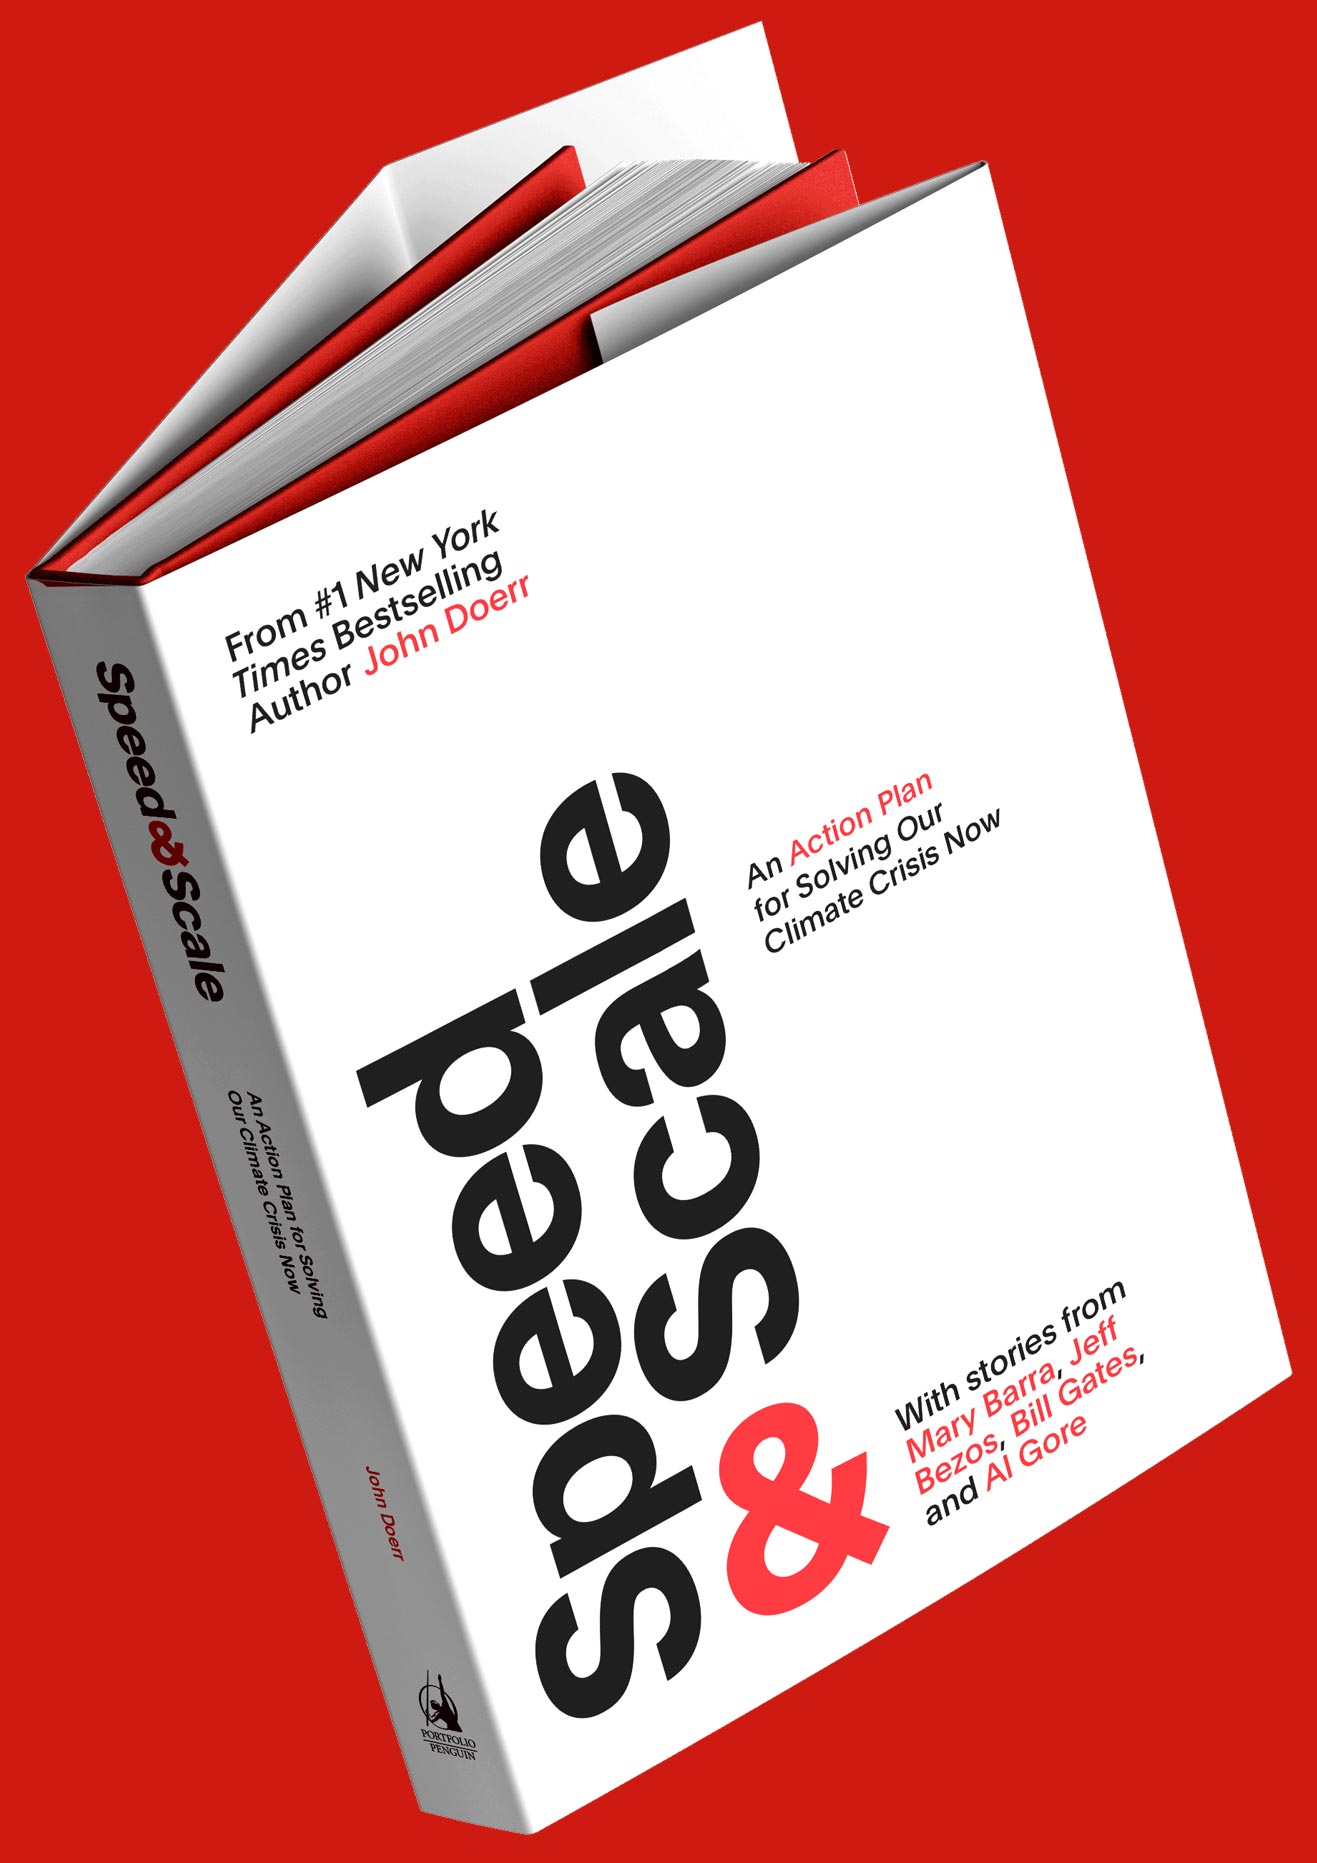
Latest
The Movement