An Action Plan for Solving Our Climate Crisis Now

1.0
Electrify Transportation
โ†’
Reduce 8 gigatons of transportation emissions to 2 gigatons by 2050.
1.1
Price
โ†’

Achieve global price parity between EVs and gas-powered vehicles by top emitters by 2030.

Updated April 2025
Insufficient Progress

$55,694 (average EV) vs. $45,264 (average full-size car) in the U.S.

Source: Kelley Blue Book, 2024

1.2
Cars
โ†’

Increase EV sales to 50% of all new car sales by 2030, 95% by 2040.

Updated April 2025
Insufficient Progress

EV share of car sales was 24.0% in 2024

(BEVs and PHEVs)

Source: BloombergNEF, 2025

1.3
Buses
โ†’

Electrify all new buses by 2030.

Updated April 2025
Failing

27.2% of new bus purchases were electric in 2023

Source: BloombergNEF, 2023

1.4
Trucks
โ†’

Increase sales of zero-emissions medium and heavy trucks to 30% of all new truck sales by 2030; 95% by 2045.

Updated April 2025
Failing

Electric share of global truck sales was 0.9% in 2023

(BEVs, FCVs, and PHEVs)

Source: BloombergNEF, 2023

1.5
Miles โ†“ 5 Gt
โ†’

Increase miles driven by electric vehicles (two- and three-wheelers, cars, buses, and trucks) to 50% of the global total by 2040, 95% by 2050.

Updated May 2025
Insufficient Progress

EV global share of miles driven across road vehicles in 2023: 6.3%

(BEVs, FCVs, and PHEVs)

Source: BloombergNEF,ย 2024

1.6
Planes โ†“ 0.3 Gt
โ†’

Increase low-carbon fuel for aviation to 40% by 2040.

Updated April 2025
Failing

0.3% of fuel use is low-carbon

Source: BloombergNEF, 2025

1.7
Maritime โ†“ 0.6 Gt
โ†’

Deploy low-carbon fuel for 5% of maritime shipping by 2030; zero out emissions for the shipping industry by 2050.

Updated April 2025
Failing

Zero percent of new ships are low-carbon

Source: Global Martime Forum, 2024

2.0
Decarbonize the Grid
โ†’
Reduce 24 gigatons of global electricity and heating emissions to 3 gigatons by 2050.
2.1
Zero Emissions โ†“ 16.5 Gt
โ†’

Tap emissions-free sources to generate 50% of electricity worldwide by 2026, 90% by 2035.*

Updated April 2025
Insufficient Progress

39% of electricity came from emissions free sources in 2023

Source: Energy Institute, 2024

2.2
Solar & Wind
โ†’

Make the cost of solar and wind lower than fossil fuels by 2025.

Updated April 2025
Achieved

On average Solar PV is $37 per MWh cheaper than fossil fuels

Source: BloombergNEF, 2025

2.3
Storage
โ†’

Reduce the cost of short-duration electricity storage to less than $50 per kWh by 2028 and the cost of long-duration electricity storage (up to 30 days) below $10 per kWh by 2030.

Updated April 2025
Insufficient Progress

Short-duration storage: $165 per kWh

Long-duration storage: Limited Data

Source: BloombergNEF, 2024

2.4
Coal & Gas
โ†’

Stop the build-out of new coal and gas plants immediately; retire or zero out emissions from existing plants by 2040.*

Updated April 2025
Code Red

Now in operation globally: 6,538 coal-fired plants and 7,986 gas plants

Source: Global Energy Monitor, 2025


2.5
Methane Emissions โ†“ 3 Gt
โ†’

Reduce flaring and eliminate leaks and venting from coal, oil, and gas sites by 2030.

Updated April 2025
Code Red

3 gigatons of methane emissions from the energy sector in 2023 (CO2 equivalent)

2.6
Heating & Cooking โ†“ 1.5 Gt
โ†’

Cut fossil fuels for heating and cooking in half by 2040.*

Updated April 2025
Failing

In 2022, building heating generated 2.5 Gt of emissions and over 7 billion people used fossil fuels for cooking

2.7
Cleaner Economy
โ†’

Triple the ratio of GDP to fossil fuel consumption.

Updated April 2025
Insufficient Progress

Global average: $252 of GDP per Exajoule of Fossil Fuel Consumption

3.0
Fix Food
โ†’
Reduce 9 gigatons of agricultural emissions to 2 gigatons by 2050.
3.1
Farm Soils โ†“ 2 Gt
โ†’

Improve soil health by increasing carbon content in topsoils to a minimum of 3% by 2035.

Updated April 2025
Limited Data

Limitedย Data

3.2
Fertilizers โ†“ 0.5 Gt
โ†’

Stop overuse of nitrogen-based fertilizers and develop cleaner alternatives to cut emissions in half by 2050.

Updated April 2025
Failing

The world uses 65.4 kilograms per hectare of nitrogen-based fertilizers

Source: Food and Agriculture Organization and Our World in Data, 2024

3.3
Cows โ†“ 3 Gt
โ†’

Cut emissions from beef and dairy consumption by 25% by 2030, 50% by 2050.

Updated April 2025
Code Red

3.3 gigatons of emissions from beef and dairy in 2022

3.4
Rice โ†“ 0.5 Gt
โ†’

Reduce methane and nitrous oxide from rice farming by 50% by 2050.

Updated April 2025
Failing

1.1 gigaton of CO2e resulting from rice production

Source: Our World in Data, 2024

3.5
Food Waste โ†“ 1 Gt
โ†’

Cut food waste to 10% by 2050.

Updated April 2025
Failing

31% of food in the US is wasted

Source: ReFed, 2024

4.0
Protect Nature
โ†’
Go from 6 gigatons of emissions to -1 gigatons by 2050.
4.1
Forests โ†“ 6 Gt
โ†’

Achieve net zero deforestation by 2030; end logging and other destructive practices in primary forests.

Updated April 2025
Code Red

19.3 million hectares of permanent tree cover loss

Source: Global Forest Watch, 2024

4.2
Oceans โ†“ 1 Gt
โ†’

Protect 30% of oceans by 2030, 50% by 2050.

Updated April 2025
Failing

8.4% of the earth’s oceans are protected

Source: Protected Planet, 2024

4.3
Lands
โ†’

Expand protected lands to 30% by 2030, 50% by 2050.

Updated April 2025
Insufficient Progress

17.6% of the world’s lands are protected

Source: Protected Planet, 2024

5.0
Clean Up Industry
โ†’
Reduce 12 gigatons of industrial emissions to 4 gigatons by 2050.
5.1
Steel โ†“ 3 Gt
โ†’

Reduce emissions from steel production 50% by 2030, 90% by 2040.

Updated April 2025
Code Red

3.4 gigatons of emissions from steel production (CO2 equivalent)

Source: Climate TRACE, 2025

5.2
Cement โ†“ 2 Gt
โ†’

Reduce emissions from cement production 25% by 2030, 90% by 2040.

Updated April 2025
Code Red

3 gigatons of emissions from cement production (CO2 equivalent)

Source: UNEP, 2024

5.3
Other Industries โ†“ 3 Gt
โ†’

Reduce emissions from other industrial sources (primarily plastics, chemicals, paper, aluminum, glass, and apparel) 60% by 2050.

Updated April 2025
Code Red

5.1 gigatons emitted from other industries (CO2 equivalent)

Source: Climate TRACE, 2025

6.0
Remove Carbon
โ†’
Remove 10 gigatons of carbon dioxide per year from the atmosphere.
6.1
Nature-Based Removal โ†“ 5 Gt
โ†’

Increase carbon removal by at least 3 gigatons per year by 2030 and 5 gigatons by 2040.

Updated April 2025
Code Red

0.05 gigatons of nature-based carbon removal being tracked

Source: Climate Focus, 2025

6.2
Engineered Removal โ†“ 5 Gt
โ†’

Remove at least 1 gigaton per year by 2030 and 5 gigatons by 2050.

Updated April 2025
Code Red

Currently, 0.0006 gigatons are being removed annually

Source: CDR.fyi, 2024

7.1
Net Zero Pledges
โ†’

The five top emittersโ€™ heads of state say their countries will reach net zero by 2050.*

Updated May 2025
Insufficient Progress

China: 2060

U.S.: No Current Target*

EU: 2050

India: 2070

Russia: 2060

7.2
Action Plans
โ†’

The five top emitters are on track to cut emissions in half by 2030.

Updated April 2025
Code Red

2030 trajectory (Policies and action against fair share):

China: <3ยฐC

US: <3ยฐC

EU: <3ยฐC

India: <3ยฐC

Russia: 4ยฐC


Source: Climate Action Tracker, 2024

7.3
Carbon Price
โ†’

National prices on greenhouse gases are set at a minimum of $75 per ton, rising 5% annually.

Updated April 2025
Insufficient Progress

Global average price: $36 per ton

24% of global emissions are covered by a carbon pricing mechanism


7.4
Subsidies
โ†’

Eliminate direct subsidies to fossil fuel companies.

Updated April 2025
Failing

$1.3 trillion in explicit fossil fuel subsidies globally

7.5
Methane
โ†’

The top five emitters pledge to control flaring, prohibit venting, and mandate prompt capping of methane leaks.

Updated April 2025
Code Red

The top five emitters take the Global Methane Pledge

China – No pledge

US – Pledge

EU – Pledge

India – No pledge

Russia – No pledge

Source: Global Methane Pledge, 2024

7.6
Refrigerants
โ†’

The top five emitters commit to phasing out hydrofluorocarbons (HFCs).

Updated April 2025
On Track

All five major emitters have ratified the Kigali amendment

8.1
Voters
โ†’

The climate crisis becomes a top-three issue.

Updated April 2025
Failing

Climate ranked ninth globally out of eighteen top issues

Source: Ipsos, 2025

8.2
Government
โ†’

A majority of key government officials support the drive to net zero.

Updated April 2025
Limited Data

Limited Data

8.3
Business
โ†’

100% of Fortune Global 500 companies commit to reach net zero by 2050.

Updated April 2025
Failing

15.0% of Fortune Global 500 Companies have a net zero commitment

Source: Speed & Scale, 2025

Data is pulled from Fortune Global 500 websites to track emissions targets of each corporation

8.4
Education
โ†’

The world achieves universal education through ninth grade by 2040.

Updated April 2025
Failing

74.7% of students complete education through a ninth-grade level

Source: World Bank, 2024

8.5
Health
โ†’

The world eliminates pollution-linked mortality by 2040.

Updated April 2025
Insufficient Progress

1.9 years (global average loss of life due to air pollution)

Source: Air Quality Life Index (AQLI), 2025

8.6
Jobs
โ†’

The global clean energy transition creates 65 million new jobs by 2040.

Updated April 2025
Insufficient Progress

16.2 million people employed in clean energy jobs

9.1
Batteries
โ†’

10,000 GWh of batteries are produced annually at less than $80 per kWh by 2035.

Updated April 2025
On Track

Production: 3,786 per GWh

Price: $115 per kWhย 

Source: BloombergNEF, 2024

9.2
Electricity
โ†’

The cost of zero-emissions baseload power drops to $0.02 per kWh by 2030.

Updated April 2025
On Track

$0.03 per kWh forย utility-scale onshore wind

$0.04 per kWh for utility-scale solar PV

9.3
Green Hydrogen
โ†’

The cost of producing hydrogen from zero-emissions sources drops to $2 per kg by 2030, $1 per kg by 2040.

Updated April 2025
Failing

$4-$12 per kg, not currently produced at scale

Source: BloombergNEF, 2024

9.4
Carbon Removal
โ†’

Cost of engineered carbon dioxide removal falls to $100 per ton by 2030, $50 per ton by 2040.

Updated April 2025
Insufficient Progress

Weighted average of $316 per ton of carbon removed through DACCS, not at scale

Source: CDR.fyi, 2025

9.5
Carbon-Neutral Fuels
โ†’

Cost of synthetic fuel drops to $2.50 per gallon for jet fuel and $3.50 for gasoline by 2035.

Updated April 2025
Failing

Jet Fuel: $2.38 (Traditional) vs. $5.95 (Sustainable)

Vehicle Fuel: $3.24 (Diesel) vs. $3.96 (Biodiesel)

Source: International Air Transport Association, BloombergNEF, and Alternative Fuels Data Center, 2024

Diesel and Biodiesel are U.S. prices

10.1
Financial Incentives
โ†’

Global government support and incentives for clean energy expand to $600 billion per year.

Updated April 2025
Limited Data

Limited Data

10.2
Government R&D
โ†’

Public investment in sustainability research and development increases to $120 billion per year.

Updated April 2025
Insufficient Progress

Low carbon R&D globally: $29.4 billion

10.3
Venture Capital
โ†’

Private investment into cleantech startups totals $50 billion per year.

Updated April 2025
Insufficient Progress

$32.1 billion invested in climate tech startups

Source: BloombergNEF, 2025

10.4
Project Financing
โ†’

Clean energy project financing rises to $1 trillion per year.

Updated April 2025
Achieved

Clean energy financing is at an all-time high, hitting $1.3 trillion

Source: BloombergNEF, 2025

10.5
Philanthropy
โ†’

Philanthropic dollars for tackling emissions grow to $30 billion per year.

Updated April 2025
Insufficient Progress

Less than 2% (between $9 billion and $16 billion) of philanthropic giving is dedicated to climate change mitigation

C is for Carbon Capture & Removal ๐ŸŒŽ

Even after we reduce global emissions as much as we can, according to the Speed & Scale plan, weโ€™ll still need to remove around 10 gigatons of leftover carbon from the atmosphere each year. We need innovation to capture CO2 at scale directly from the air, and then contain it for centuries. 

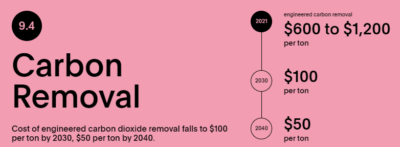
The immediate challenge is to lower the cost of direct air capture to under $100 per ton by 2030 and to under $50 per ton by 2050. Weโ€™re currently lagging in our progress toward that target, but innovative efforts around the world can help us reach our short-term and longer-term goals.

While carbon removal has been around for some time, newer technologiesโ€“led by direct air captureโ€“are adding to our toolkit. Governments around the world are investing in novel technologies to capture and remove carbon from our atmosphere more efficiently.

Types of carbon removal

(Source: Mercator Institute)

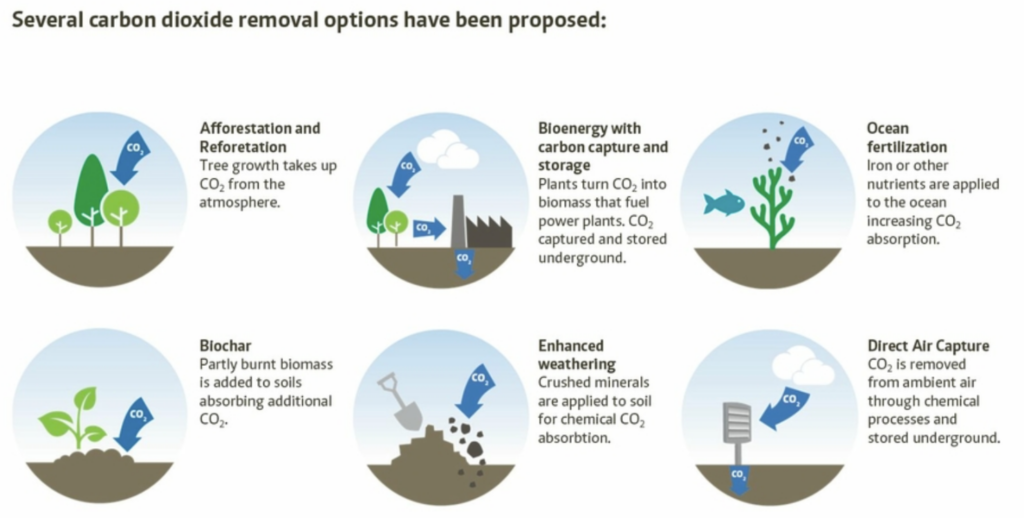
Nature-based removal initiatives include afforestation or reforestation, where forest ecosystems are created or restored to remove carbon dioxide from the air and store it via photosynthesis. Farmers and agriculture companies are also working to harness soilโ€™s ability to sequester carbon through regenerative practices such as farming without tilling to minimize soil disturbance and growing plants among crops to provide them with cover.

Engineered carbon removal, on the other hand, refers to technologies that remove carbon dioxide. One notable example is direct air capture, the process of scrubbing CO2 from the atmosphere and storing it underground or in materials with long lifespans, such as concrete. Unlike carbon capture and storage technologies, direct air capture can remove excess carbon thatโ€™s already in the atmosphere, rather than capturing emissions at the source. 

To accelerate investment in carbon removal, some private sector leaders are getting ahead of the game. Frontier, an advance market commitment founded by Stripe, Alphabet, McKinsey, and other major companies, aims to spur the development of these technologies by committing to buy an initial $1 billion in permanent carbon removal by 2023. 

With more public and private organizations investing in innovation and supporting efforts to integrate carbon removal into our infrastructure, we can take a big step forward toward net zero.

Additional Resources