An Action Plan for Solving Our Climate Crisis Now

1.0
Electrify Transportation
Reduce 8 gigatons of transportation emissions to 2 gigatons by 2050.
1.1
Price

EVs achieve price and performance parity with new combustion-engine vehicles in the U.S. by 2024, and in India and China by 2030.

Updated May 2023
Off Course

$64,507 (average EV) vs. $44,761 (average full-size car)

Data: Kelley Blue Book

Date: Dec. 2022

1.2
Cars

One of two new personal vehicles purchased worldwide are EVs by 2030, 95% by 2040.

Updated June 2023
Strong Momentum

EV share of global auto sales was 14% in 2022

(BEVs, FCVs, and PHEVs)

Data: BloombergNEF

Date: March 2023

1.3
Buses & Trucks

All new buses are electric by 2025; 30% of medium and heavy trucks purchased are zero-emissions vehicles by 2030; 95% of trucks by 2045.

Updated May 2023
Limited Progress

Over the past decade, e-bus share has grown from 1% to 44%

Data: BloombergNEF

Date: 2021

1.4
Miles ↓ 5 Gt

50% of miles driven globally (two- and three-wheelers, cars, buses, and trucks) are electric by 2040, 95% by 2050.

Updated May 2023
Code Red

EV global share of miles driven: 7.3%

Data: BloombergNEF

Date: 2021

1.5
Planes ↓ 0.3 Gt

Low-carbon fuel powers 20% of miles flown by 2025; carbon-neutral fuel powers 40% of miles flown by 2040.

Updated May 2023
Off Course

<0.1% of flights use sustainable aviation fuel (SAF)

Data: IATA

Date: 2022

1.6
Maritime ↓ 0.6 Gt

Shift all new construction to “zero-ready” ships by 2030.

Updated May 2023
Off Course

Projected launch of first carbon-neutral ships: 2023

Data: Maersk

Date: 2022

2.0
Decarbonize the Grid
Reduce 24 gigatons of global electricity and heating emissions to 3 gigatons by 2050.
2.1
Zero Emissions ↓ 16.5 Gt

50% of electricity worldwide comes from zero-emissions sources by 2025, 90% by 2035.

Updated May 2023
Strong Momentum

Global market share of zero-emissions electricity: 38%

Data: IEA

Date: 2021

2.2
Solar & Wind

Solar and wind are cheaper to build and operate than emitting sources in all countries by 2025

Updated May 2023
Strong Momentum

96% of the world’s population lives in nations where renewable sources are cheaper than fossil fuels

Data: BloombergNEF

Date: 2022

2.3
Storage

Electricity storage drops below $50 per kWh for short duration (4–24 hours) by 2025, $10 per kWh for long duration (14–30 days) by 2030.

Updated May 2023
Off Course

Short-term storage: $324/kWh

Data: BloombergNEF

Date: 2022

2.4
Coal & Gas

No new coal or gas plants from 2023 on; existing plants to retire or zero out emissions by 2025 for coal and by 2035 for gas.*

Updated May 2023
Code Red

Now under construction globally: 374 coal-fired units and 505 gas-plant units

Data: Global Energy Monitor

Date: January 2023

2.5
Methane Emissions ↓ 3 Gt

Eliminate leaks, venting, and most flaring from coal, oil, and gas sites by 2025.

Updated May 2023
Code Red

Methane emissions were approximately 3 gigatons in 2022

Data: IEA

Date: 2022

2.6
Heating & Cooking ↓ 1.5 Gt

Cut gas and oil for heating and cooking in half by 2040.* 

Updated May 2023
Code Red

Fossil fuels power 41% of cooking stoves and heat 58% of U.S. homes

Data: U.S. Census Bureau

Date: 2021

2.7
Clean Economy

To more than triple the energy productivity rate by 2035, we must phase out fossil fuels while also boosting energy efficiency.

Updated May 2023
Limited Progress

World average: $240 in GDP per $1 of fuel consumption

Data: BP Statistical Review and World Bank

Date: 2021

3.0
Fix Food
Reduce 9 gigatons of agricultural emissions to 2 gigatons by 2050.
3.1
Farm Soils ↓ 2 Gt

Improve soil health through practices that increase carbon content in topsoils to a minimum of 3%.

Updated May 2023
Off Course

1.4%: Average carbon content of farm soils in the U.S.

Data: U.S. Dept. of Agriculture

Date: 2013; published 2017

3.2
Fertilizers ↓ 0.5 Gt

Stop the overuse of nitrogen-based fertilizers and develop greener alternatives to cut emissions in half by 2050.

Updated October 2022
Off Course

69.8 kilograms per hectare: global average for nitrogen-based fertilizers

Data: FAO

Date: 2019

3.3
Consumption ↓ 3 Gt

Promote lower-emissions proteins, cutting annual consumption of beef and dairy 25% by 2030, 50% by 2050.

Updated October 2022
Code Red

U.S. per capita weekly consumption: 1.1 lbs. of beef and 3.8 lbs. of dairy

Data: OECD

Date: 2020

3.4
Rice ↓ 0.5 Gt

Reduce methane and nitrous oxide from rice farming by 50% by 2050.

Updated May 2023
Off Course

1 gigaton of CO2e resulting from rice production

Data: WRI and the Sustainable Rice Platform

Date: 2014 and 2021

3.5
Food Waste ↓ 1 Gt

Lower the food waste ratio from 40% of all food produced to 10%.

Updated May 2023
Off Course

40%: estimated global portion of food that is wasted

Data: WWF and Tesco

Date: 2021

4.0
Protect Nature
Go from 6 gigatons of emissions to -1 gigatons by 2050.
4.1
Forests ↓ 6 Gt

Achieve net zero deforestation by 2030; end destructive practices and logging in primary forests.

Updated April 2023
Code Red

3.75 million hectares of primary forest lost annually

Data: Global Forest Watch

Date: 2021

4.2
Oceans ↓ 1 Gt

Eliminate deep-sea bottom trawling and protect at least 30% of oceans by 2030, 50% by 2050.

Updated April 2023
Limited Progress

8% of coastal oceans are protected

Data: Protected Planet

Date: June 2022

4.3
Lands

Expand protected lands from 17% today to 30% by 2030, 50% by 2050.

Updated August 2022
Off Course

17% of global lands are protected

Data: Protected Planet

Date: June 2022

5.0
Clean Up Industry
Reduce 12 gigatons of industrial emissions to 4 gigatons by 2050.
5.1
Steel ↓ 3 Gt

Reduce total carbon intensity of steel production 50% by 2030, 90% by 2040.

Updated May 2023
Code Red

1.9 tons of CO2 emitted per 1 ton of steel produced

Data: WorldSteel.org

Date: 2021

5.2
Cement ↓ 2 Gt

Reduce total carbon intensity of cement production 25% by 2030, 90% by 2040.

Updated May 2023
Code Red

0.6 tons of CO2 emitted per 1 ton of cement produced

Data: IEA

Date: 2021

5.3
Other Industries ↓ 2 Gt

Reduce emissions from other industrial sources (primarily plastics, chemicals, paper, aluminum, glass, and apparel) 80% by 2050.

Updated April 2023
Code Red

5 gigatons emitted by other industries

Data: UNEP

Date: 2020

6.0
Remove Carbon
Remove 10 gigatons of carbon dioxide per year from the atmosphere.
6.1
Nature-Based Removal ↓ 5 Gt

Remove at least 1 gigaton per year by 2025, 3 gigatons by 2030, and 5 gigatons by 2040.

Updated May 2023
Off Course

0.28 gigatons of nature-based carbon removal being tracked

Data: Climate Focus

Date: 2022

6.2
Engineered Removal ↓ 5 Gt

Remove at least 1 gigaton per year by 2030, 3 gigatons by 2040, and 5 gigatons by 2050.

Updated May 2023
Off Course

Currently, 43 metric tons are being removed annually

Data: BloombergNEF

Date: 2021

7.1
Commitments

Each country enacts a national commitment to reach net-zero emissions by 2050 and gets at least halfway there by 2030.

Updated August 2022
Limited Progress

EU and UK: cut emissions in half by 2030; net zero by 2050

U.S.: Congress passed climate laws that target a 40% cut by 2030.

China: net zero by 2060

India: net zero by 2070

Russia announced net zero 2060, though no formal adoption

7.2
Subsidies

End direct and indirect subsidies for fossil fuel companies and for harmful agricultural practices.

Updated August 2022
Code Red

The top five emitters still pay a total of nearly $4 trillion in fossil fuel subsidies. Globally, nations are paying $5.9 trillion, including healthcare spending due to air pollution and other indirect costs.

Source: IMF
Date: 2020

7.3
Price on Carbon

Set national prices on CO2 emissions at a minimum of $55 per ton, rising 5% annually.*

Updated August 2022
Off Course

EU: $100/ton; member states implement their own price schedules

UK: $20/ton

China: $10/ton

U.S.: No national price. 12 states set prices

India: No national price

Russia: No national price

7.4
Global Bans

Prohibit HFCs as refrigerants and ban single-use plastics for all non-medical purposes.

Updated August 2022
Limited Progress

U.S. aims to reduce HFCs 85% by 2036.
The EU aims to reduce HFCs 67% from 2010 by 2030.
China aims to reduce HFCs 68% by 2025.

7.5
Government R&D

Double (at minimum) global public investment into research and development; quadruple it in the United States.

Updated August 2022
Off Course

China: $7.9 billion
U.S.: $9.4 billion
EU + UK: $8.7 billion
India: $110 million
Russia: little to no allocation

Data: IEA

Date: 2020

8.1
Voters

The climate crisis is a top-two voting issue in the twenty top-emitting countries by 2025.

Updated August 2022
Off Course

Climate’s rank as top issue: #9 in the U.S., #8 globally, #2 (tied) in Europe

Data: Gallup (May 2022), Ipsos (June 2022), and Eurobarometer (Jan. 2022)

*different surveys can only be roughly compared to each other


8.2
Government

A majority of government officials—elected or appointed—will support the drive to net zero.

Updated May 2023
Off Course

47% of heads of state (7 of 15 top-emitting nations)

27% of national legislatures (4 of 15 top-emitting nations)

Data: EDGAR

Date: 2021

8.3
Business

100% of Fortune Global 500 companies commit immediately to reach net zero by 2040.

Updated May 2023
Off Course

3.4% of Global 500 companies committed to net zero by 2040 across Scope 1-2-3 emissions

6.2% of Global 500 companies committed to net zero by 2050 across Scope 1-2-3 emissions

Data: Speed & Scale

Date: November 2022


8.4
Education Equity

The world achieves universal primary and secondary education by 2040.

Updated May 2023
Off Course

129 million girls out of school

Data: UNICEF

Date: 2022

8.5
Health Equity

Eliminate the gaps among racial and socioeconomic groups in mortality rates from air pollution by 2040.

Updated August 2022
Off Course

2.2 years (global average loss of life due to air pollution)

5 years (lost lifespan in S. Asia, Niger Delta, other low-income regions)

Data: Air Quality Life Index (AQLI)

Date: 2021

8.6
Economic Equity

The global clean energy transition creates 65 million new jobs, equitably distributed and outpacing the loss of fossil fuel jobs.

Updated May 2023
Limited Progress

13 million people employed directly and indirectly

Data: IRENA

Date: 2021

9.1
Batteries

Produce 10,000 GWh of batteries yearly at less than $80 per kWh by 2035.

Updated August 2022
Strong Momentum

Production: ~834GWh

Price: $132 per kWh 

Sources: BloombergNEF

Date: 2021

9.2
Electricity

Cost of zero-emission baseload power reaches $0.02 per kWh by 2030, with peak-demand power reaching $0.08 per kWh.

Updated May 2023
Strong Momentum

5 cents/kWh cost for utility-scale solar

Data: IRENA

Date: 2021

9.3
Green Hydrogen

Cost of producing hydrogen from zero-emissions sources drops to $2 per kg by 2030, $1 per kg by 2040.

Updated May 2023
Off Course

$2-$12 per kg, not currently produced at scale

Source: BloombergNEF

Date: 2021

9.4
Carbon Removal

Cost of engineered carbon dioxide removal falls to $100 per ton by 2030, $50 per ton by 2040.

Updated May 2023
Off Course

$600 to $1,200 per ton of carbon removed, not at scale

Source: Bloomberg and Climeworks

Date: 2021

9.5
Carbon-Neutral Fuels

Cost of synthetic fuel drops to $2.50 per gallon for jet fuel and $3.50 for gasoline by 2035.

Updated August 2022
Off Course

Jet Fuel: $4.22 (Traditional) vs. $22.13 (Sustainable) ~ 5.3X

Vehicle Fuel: $5.72 (Diesel) vs. $6.26 (Biodiesel) ~ 1.1X

U.S. prices when available. No pricing or availability for carbon-neutral fuels. Limited availability and price transparency for sustainable aviation fuels.

Data: IATA, BloombergNEF, GlobalPetrolPrices.com, AFDC

Date: June 2022


10.1
Financial Incentives

Increase global government incentives and support for clean energy from $128 billion to $600 billion per year.

Updated May 2023
Off Course

$128 billion in global government incentives for renewable power generation, which is 20% to 35% of total direct fossil fuel subsidies

Source: IRENA

Date: 2020

10.2
Government R&D

Increase public-sector funding of energy R&D from $9.2 billion to $40 billion a year in the U.S.; other countries should aim to triple funding.

Updated May 2023
Limited Progress

U.S. energy R&D budget: $9.2 billion

Source: IEA

Date: 2021

10.3
Venture Capital

Expand investment of capital into U.S. startup companies to $50 billion per year.

Updated May 2023
Achieved

$59 billion invested in U.S. climate tech startups, up from $17 billion in 2020

Source: BloombergNEF

Date: 2022

10.4
Project Financing

More than double zero-emissions project financing by 2025, from $431 billion to $1 trillion per year.

Updated May 2023
Limited Progress

Clean energy financing reached an all-time high last year, hitting $583 billion

Source: BloombergNEF

Date: 2022

10.5
Philanthropic Investing

Increase philanthropic dollars from $10 billion to $30 billion per year.

Updated May 2023
Limited Progress

Less than 2% (between $7.5 billion and $12.5 billion) of philanthropic giving is dedicated to climate change mitigation

Source: ClimateWorks Foundation

Date: 2021

ResourceOctober 31, 2022

Now is The Time to Invest in Protected Bike Lanes

This might come as a surprise, but protected bike lanes are the best investment of a city’s infrastructure dollars when it comes to tackling the climate crisis.

Photo of people riding their bicycles on the two-way Green Lake protected bike lane. Photo: Seattle Department of Transportation

As cities move to reduce pollution, draw down their emissions, and create safer streets, there is no better investment for their infrastructure dollars than protected bike lanes. This simple solution eliminates emissions, improves commute times, reduces congestion, and increases personal freedom–all without breaking the bank.

Vehicles Are The Largest Source of Emissions Within Cities

In urban environments, the largest single source of CO2 emissions is the combustion of fossil fuels in cars, trucks, and buses. As cities seek to lower the carbon footprint of moving people around, they often invest in light rail, electrified buses, and charging stations. But in the race to eliminate emissions, more drastic steps are needed.

While expanding public transit plays a crucial role in lowering emissions, most often it isn’t enough. In much of the United States, fixed routes and resource constraints limit transit’s frequency and availability. This inconvenience explains why those who can afford to own a car or take an Uber or Lyft will choose that option. The result: an income gap between those who take public transit and those who do not. 

The most livable cities of the future will be oriented around people, not cars. In addition to vibrant public spaces and walkable neighborhoods, these cities will provide a network of connected and protected lanes for short commutes and ample public transit and EV chargers for longer commutes. 

Protected Lanes Boost Ridership, Cut Emissions, and Improve Traffic for Cars

In Copenhagen, for example, there are 237 miles of bike lanes, most of which are elevated or physically separated from car traffic by a curb. In 2018, 49 percent of all commuter trips–and 28 percent of all trips–in the city were made by bike. By contrast, barely 1 percent of commuter trips in New York City and 4 percent of trips in San Francisco involved a bicycle. 

While cars emit almost a pound of CO2 per mile traveled from their tailpipes, bikes produce none at all. Switching from taking a car to riding a bike immediately cuts carbon dioxide emissions within a city. We cannot afford to wait for the EV revolution. Given the twelve-year lifespan of an average car, the transition to zero-emission vehicles will take more than two decades. Cities need to implement solutions that tackle the emissions crisis today.

Let’s be honest; commuting can be a horrific experience. In big cities around the world, traffic grinds to a halt at rush hour. In New Delhi, you can outwalk traffic. Austin slows to 6 miles per hour, Los Angeles to 8 miles per hour. On the other hand, bike riders’ average rush hour speed is 9 miles per hour. As bikes are smaller than cars, a greater volume of them can move through the same space at higher speeds during traffic jams.

Adding bike lanes doesn’t have to slow down car traffic. When New York City added a six-foot buffered bike lane by narrowing each lane in a handful of corridors, they found that car volumes were unaffected–and that those cars moved 35 percent faster. Space for on-street parking was often preserved as well. Cities don’t have to choose between creating bike lanes and improving traffic flow—they really can have it all. 

Safety is the Biggest Barrier to Cycling Adoption

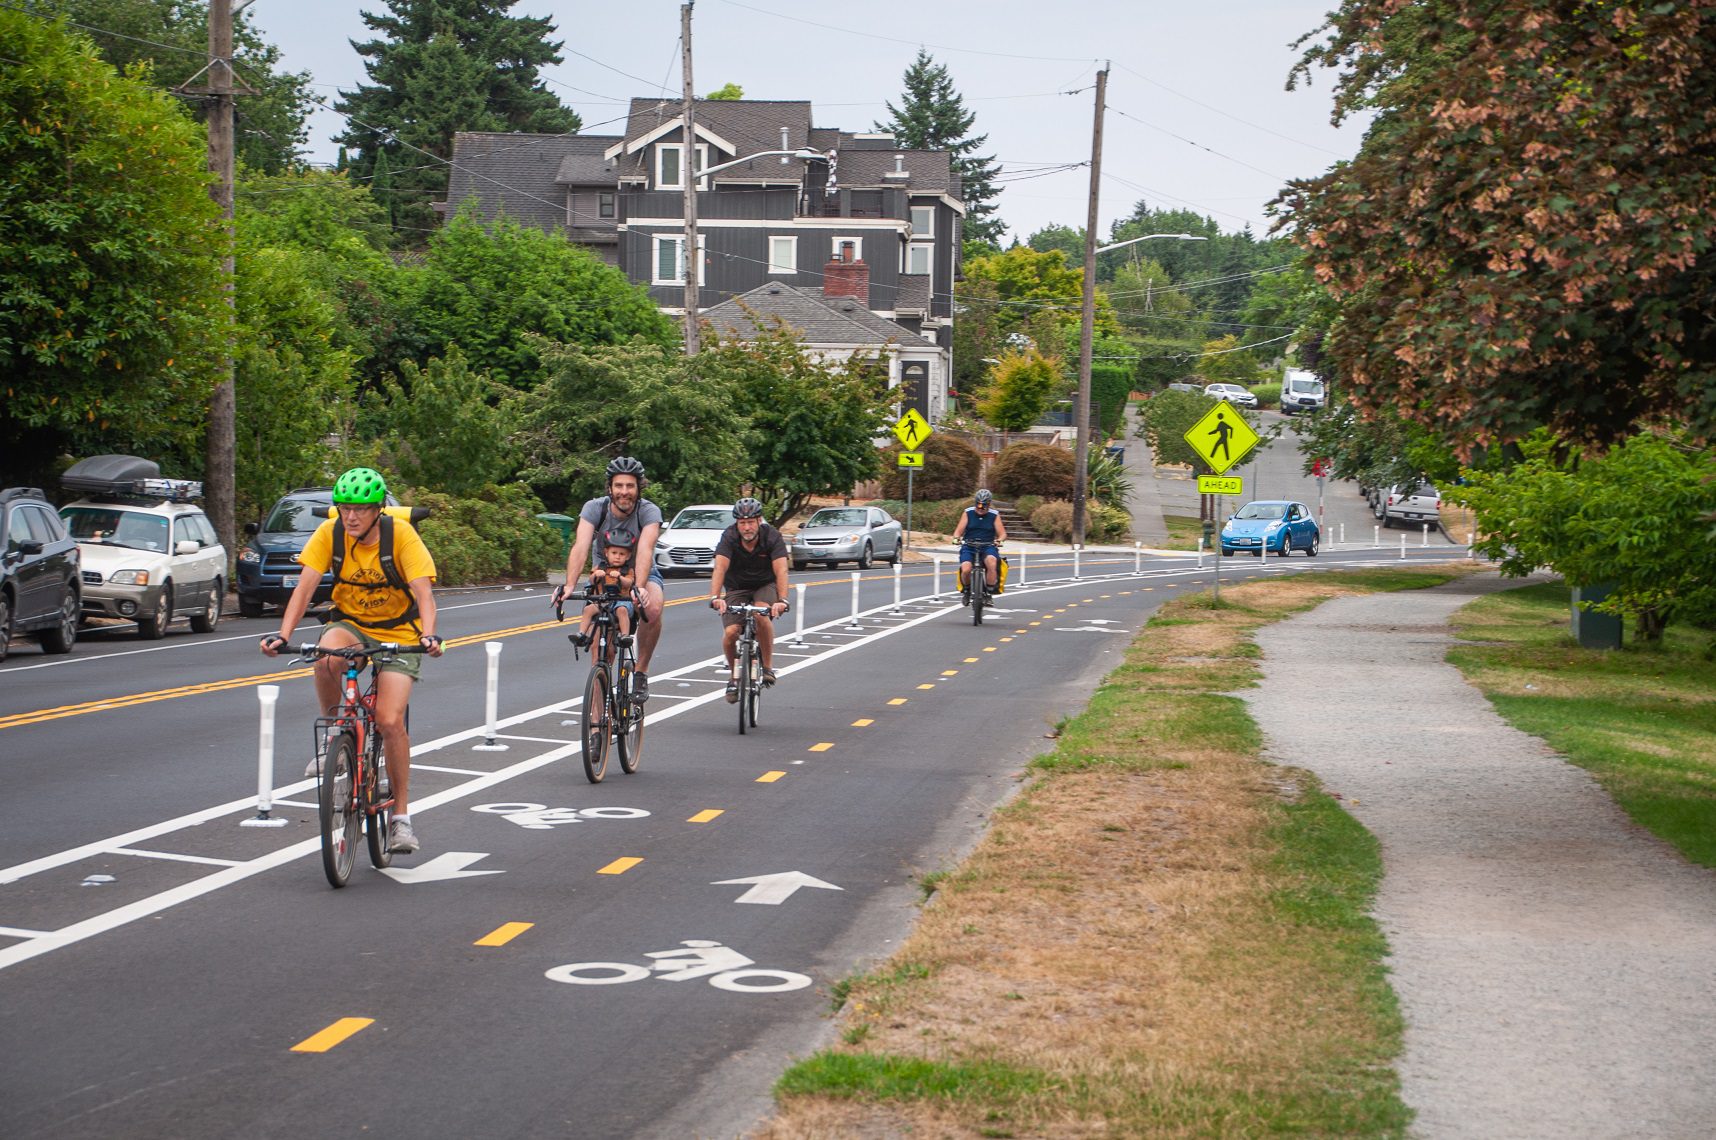
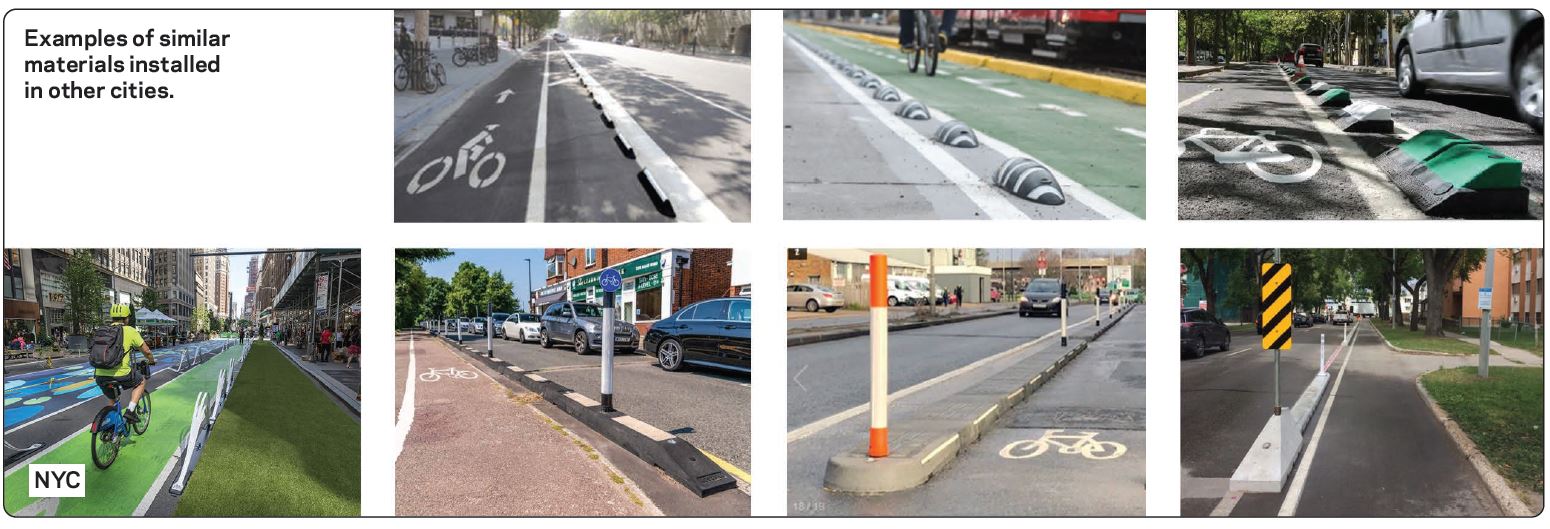
Unfortunately, without dedicated lanes that physically separate bicycle traffic from cars and pedestrians, cycling will never feel safe enough for mass adoption. Adding buffers–posts, planters, or curbs–makes people far more comfortable biking on streets. Painted lanes are not enough. When a national survey asked residents why they didn’t bike, they identified separated, protected bike lanes as a key missing element. Nearly two-thirds of residents said they “would be more likely to ride a bicycle if motor vehicles and bicycles were physically separated by a barrier.” Take Seville, Spain, which saw a fivefold increase in cycling when the city added 74 miles of new and dedicated bike lanes. 

New York City Department of Transportation (DOT)
Examples from New York City’s “Better Barriers” program, testing new materials for protected bicycle lanes

When lanes are not protected, cyclists are left to navigate an obstacle course of cars turning in front of them or pulling out or pulling in. When lanes are simply painted, they are often ignored and used for cars and trucks to load or unload, forcing bike riders to cross into traffic. These lanes are often adjacent to parked cars, whose opening doors account for up to 27 percent of car-bike collisions in cities. A shared road is still a road designed primarily for cars. 

Cyclists are six times more likely to die in the United States than in Germany, the Netherlands, or Denmark, where protected cycling infrastructure is the norm. Optimizing for cyclist safety leads to significant increases–sometimes double or more—in new and existing riders. It also leads to a 44 percent reduction in cyclist fatalities and a 50 percent reduction in injuries.

These are data points and conclusions from research from around the world. But what does your gut say? Would you let your eight-year-old ride a bicycle in a city with only painted lanes? Would you let your 80-year-old parent? Of course not. If a city wants to increase cycling and reduce carbon emissions, it needs to offer cyclists an end-to-end network of protected lanes.

A Win for Mayors, Local Officials, and the Community

To counteract the trend of increasing car ownership, cities need to take action before it is too late. In a recent survey of millennials, nearly a third who did not own a car said they planned to buy one soon. Only 6 percent said they would be purchasing a purely electric vehicle. No amount of light rail or buses can turn this tide. For a city to do battle with the perceived safety and autonomy of cars, it needs to carve out more room on roadways for cyclists.

###

Need assistance? Between November 10, 2022 to February 3, 2023, Bloomberg Philanthropies will be funding grants of $400K to $1M to cities with ambitious cycling infrastructure projects. Learn more at the Bloomberg Initiative for Cycling Infrastructure.

Image Credits: Seattle Department of Transportation and New York Department of Transportation

Additional Resources
Primers May 19, 2023

G is for Greenium 💲

Sustainable investment will be instrumental on the path to net zero. Green bonds are an important tool to facilitate sustainability projects by governments and businesses.   Green bonds are a form… Read More

The Movement

Stay in the know. Get the best, most up-to-date thinking on climate delivered to your inbox.